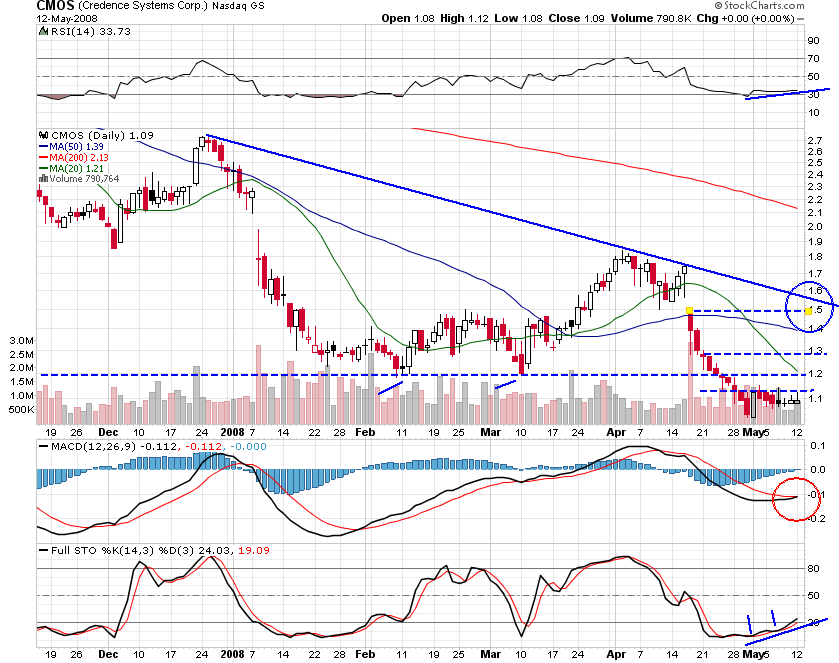
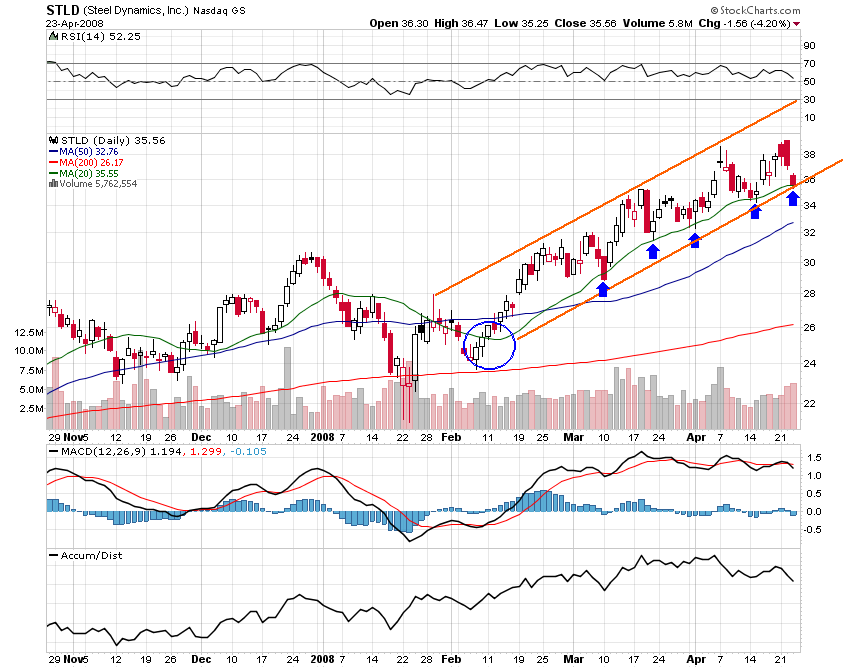
 CMOS is looking, to me, like it’s basing it’s ass off right now. This one is a good stalking candidate and on a confirming move through resistance it looks like it could move quite a bit.
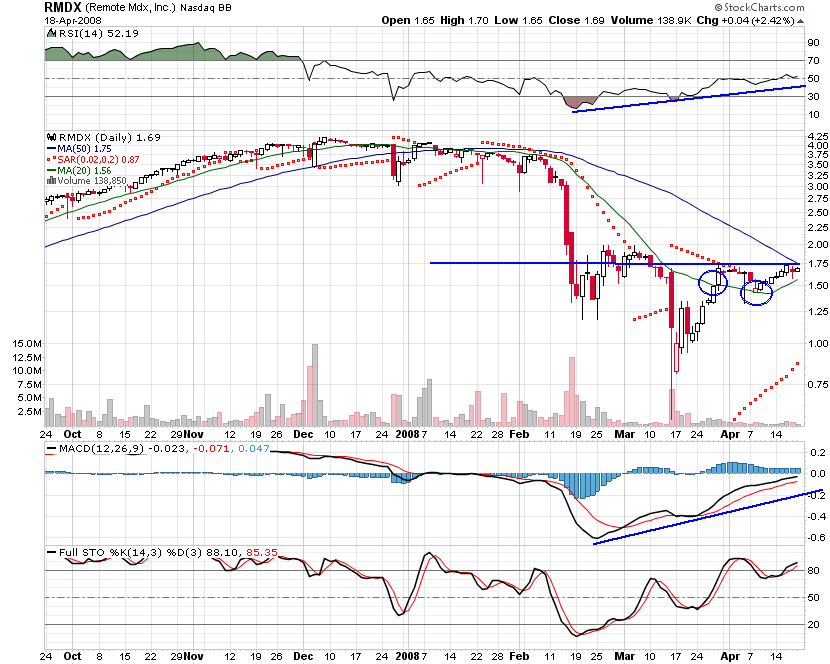
The only ugly thing on this chart is the RSI. It IS trending upwards but I would hardly call that upward.
MACD is perfect… just about to have the good ol bullish cross. The histogram is looking text book as well.
The Full Stochastic chart is moving upward and onward as well but it does look like it’s moving a little bit too slowly.
Buy on a solid cross through the first line of resistance around $1.13. The next cross to look for is through R2, @ $1.19. If it really starts to move up you can look for resistance around R3, $1.30 and R4 $1.50.
Based on the resistance of the previous trend line that intersects R4, i really don’t see this busting very easily through the $1.50 mark, but it’s possible of course.
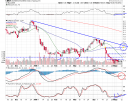
 The pic on the left is a weekly chart of CLDN. CLDN has formed an ascending triangle that is getting down to the do or die area on both the weekly and daily charts.
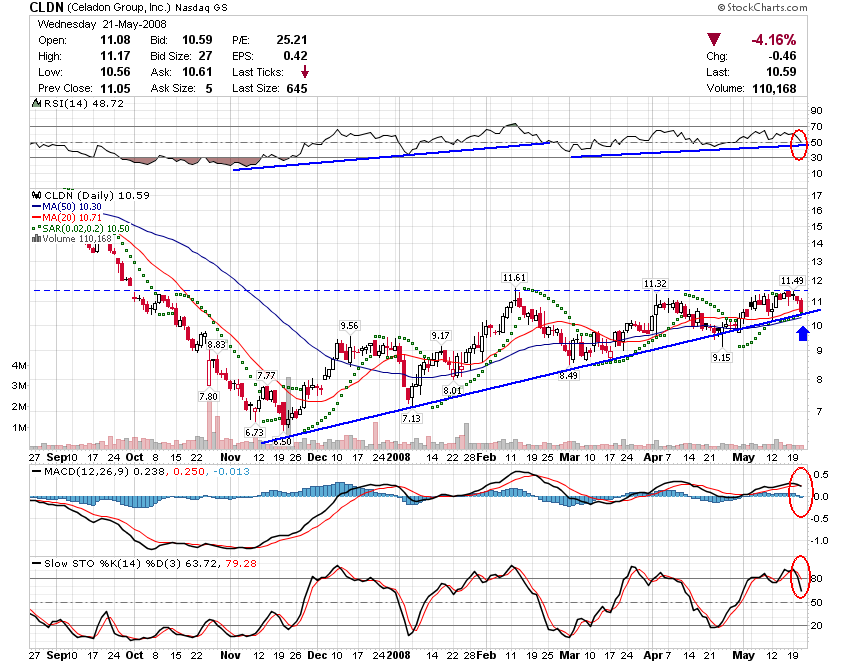 This is the daily chart. Both charts have resistance looming around $11 – $11.50.