 The pic on the left is a weekly chart of CLDN. CLDN has formed an ascending triangle that is getting down to the do or die area on both the weekly and daily charts.
.
.
.
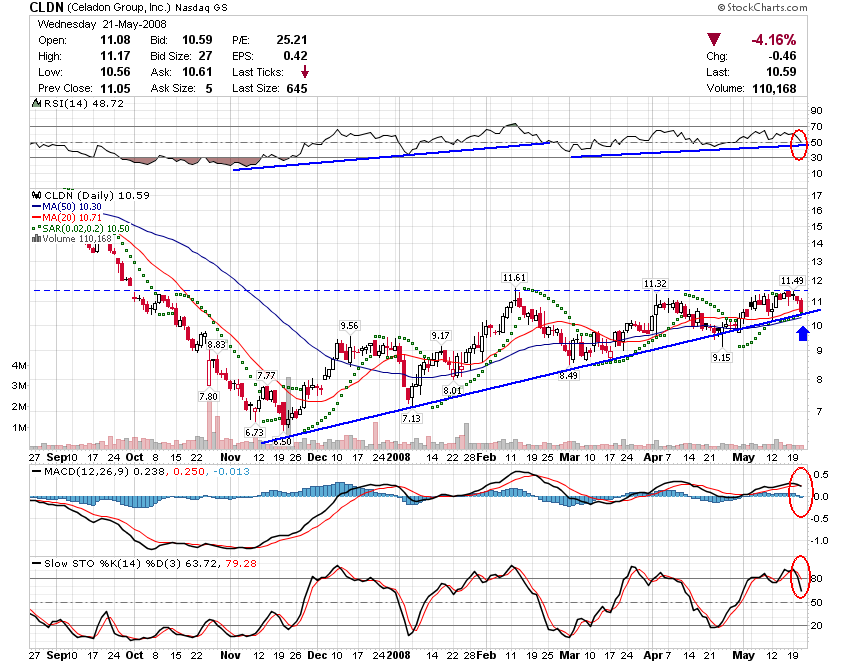 This is the daily chart. Both charts have resistance looming around $11 – $11.50.
.
.
.
On a strong push through resistance around $11.50 i would buy and ride to the 14 mark if it goes up.