PRGX: PRG-Schultz International

12 month chart of PRGXThis (very) messy 12 month chart of PRGX on the left is showing a few good signals.

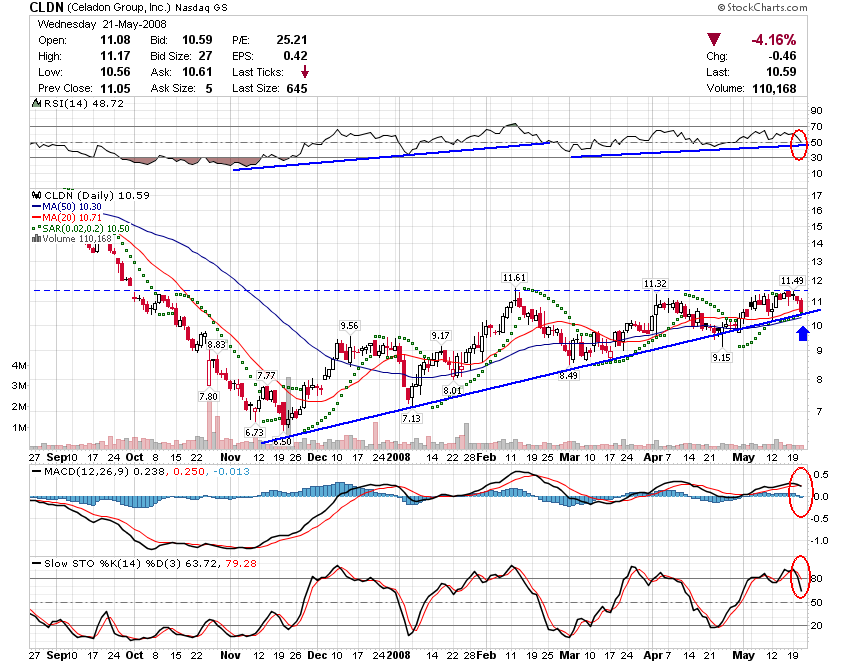
Primarily I believe PRGX has formed a cup with handle pattern and will be testing the upper resistance shortly if not Now.  There is also an upward price channel that has formed starting around mid January and it looks like the current price action is pushing UP through the middle of the channel.

Parabolic SAR is indicating a bullish move as well.

The RSI is interesting because it has been positively diverging since the crash in Novemeber.  This is a strong signal and it’s clear that it picked back up where it left off after the dip resulting from the formation of the cup’s handle.

  • Buy on strong push through the $10.10 level.
  • Look for resistance around the upper boundary of the price channel near $11 bucks
  • Stop loss, of course 😉

THQI: THQ, Inc

THQI chartTHQI appears to be setting up for a break out in the near future.

MACD is under 0 and is moving north.  In addition, it just had a bullish cross.

RSI is also moving north and a couple days ago just passed through the 80 mark which is considered a bullish signal.

STO is a little iffy imo.  The slope of it’s vertical ascent is looking a little too steep, BUT they lines have been layered in a bullish pattern since May 12th.

Resistance levels are setup pretty clearly on this chart.  You can easily spot that the price needs to bust through the $20.82 mark and we could be on our way up.

One concern is that today’s push upwards came on OK volume, but it could have been stronger.

  • Buy = Cross through $20.82 with good volume
  • R1=21.63  Fill the gap
  • R2=22.83
  • R3=23.84
  • 2-3% Trailing stop loss

CLDN: Celadon Group, Inc

cldn weekly chartThe pic on the left is a weekly chart of CLDN. CLDN has formed an ascending triangle that is getting down to the do or die area on both the weekly and daily charts.

.

.

.

cldn daily chartThis is the daily chart. Both charts have resistance looming around $11 – $11.50.

.

.

.

On a strong push through resistance around $11.50 i would buy and ride to the 14 mark if it goes up.

WNR: Western Refining

WNR TECHNICAL ANALYSISWNR might be in for a quick pop between $9.50 to about $10.50.

If we broke through $9.50 this would be a cross through two key points:

  1. The previous support floor
  2. The 20 day EMA

Speaking of the 20 day EMA, check out what happened the past two times WNR moved crossed it.  Both times (denoted with a blue arrow) resulted in a nice pop.

Another attribute i like here is the positive divergence on the MACD.  It has been slowly trending upwards starting in late March.

STO and RSI have both recently spiked with a bullish move upwards as well.

As usual i would enter this trade with a trailing stop loss probably set at around 5-6%.  Enter @ a cross through $9.50 with good volume and look for pain around $10.50.  This is a very speculative chart for me.

CMOS: Credence Systems Corp.

cmos  chartCMOS is looking, to me, like it’s basing it’s ass off right now. This one is a good stalking candidate and on a confirming move through resistance it looks like it could move quite a bit.

The only ugly thing on this chart is the RSI. It IS trending upwards but I would hardly call that upward.

MACD is perfect… just about to have the good ol bullish cross. The histogram is looking text book as well.

The Full Stochastic chart is moving upward and onward as well but it does look like it’s moving a little bit too slowly.

Buy on a solid cross through the first line of resistance around $1.13. The next cross to look for is through R2, @ $1.19. If it really starts to move up you can look for resistance around R3, $1.30 and R4 $1.50.

Based on the resistance of the previous trend line that intersects R4, i really don’t see this busting very easily through the $1.50 mark, but it’s possible of course.

DUG: Ultrashort Oil and Gas

dug chartIs it time to short Oil and Gas?  DUG is an ETF from ProShares that does exactly that and based on today’s news of oil passing $126 bucks it might be time to short?

This idea was spawned by this post on Break Out Watch and it made me want to check into DUG just to see what the chart has been up to.

While I’m not going to make any predictions (because I have no idea wtf oil/gas are going to do) here are my thoughts:

There is definitely positive divergence on both the RSI and MACD.  MACD is looking a little weak, but still trending upwards.  STO is looking like it’s about to have a pretty aggressive upward cross.  And finally, the price pattern has formed the begining of a W pattern which I like very much.  W patterns are basically a double bottom that picks up after the second bottom… For DUG we have to wait and see what pans out.

The volume has really been picking up in recent days, so it seems that movements should be pretty aggressive.

It will be interesting to see how DUG pans out over the next couple weeks.

CSAR: Caraustar Industries

chart of csarCSAR is looking like it may have finally finished building a base and is about to start climbing back upward.

RSI and MACD have been trending upwards since mid March creating positive divergence until about April 28th.

I think the chart looks pretty good and we have some minor resistance around $1.73.

Buy now @ $1.66, when the price busts through $1.73 ride it up through $1.75, $1.90, and beyond.  On any weakness or news i would sell this.