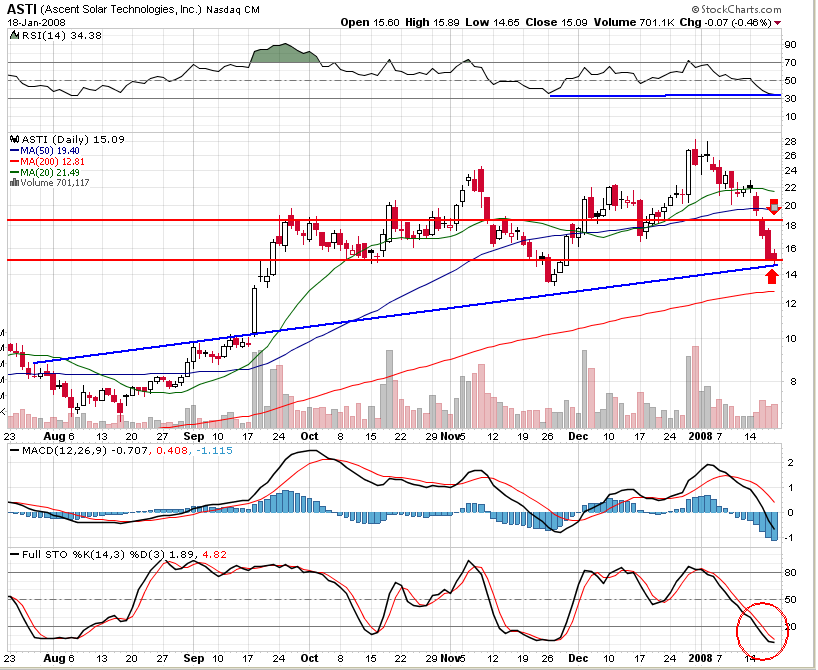
 ASTI is looking as though it may bounce off of it’s trend line in the next few days. In the chart i posted with this summary you can see three points on the trend line; the last being today.
The RSI is a bit above 30 and if you look back on the chart it rarely gets down to 30.
There is also about to be a roll over on the stochastic.
MACD, to me, is a bit ugly and a bit of a concern as I personally like MACD signals a lot. I think that it may be good to wait on this one for the price to either cross or bounce off of about $15 and see whats going on. If it crosses under and comes back up through on strong volume, then it could be a nice ride to 18-19 dollars.
I think buy around $15, and sell around $19… or after $19 just put a semi-loose stop loss on and ride it as high as you can.Â