 I think this chart of ACTU has big potential for a break out. Check out the setups on the RSI, MACD and Slow STO.
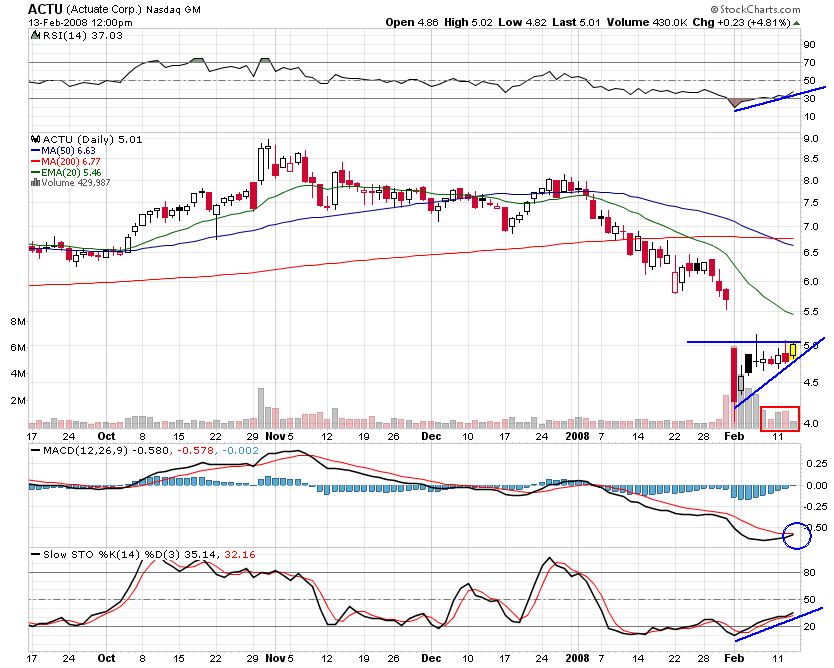
RSI is trending upwards with three touches on the trend line indicating a pretty solid/strong uptrend in this indicator.
The MACD is JUST about to have a bullish cross and is under -.50. Additionally, i like the down trend the MACD had before this cross setup formed. It’s a gradual down trend that bottomed/slowed, and is now coming up. Nothing crazy like UP DOWN UP DOWN.
Slow STO is on the way up and still under 50. This trend line is a bit like the RSI uptrend where it looks strong and consistent.
The price chart looks strong and could even be inside of a bullish triangle (not noted on chart). Resistance @ about $5.00 looks somewhat weak IMO, and this may be indicative of even more potential for a break out above the $5.00 level.
Buy upon crossing up through the $5.00 resistance line and look for New resistance just under $5.50.  A ride like that could mean 10% in your pocket!
Buy when