EFII: Electronics For Imaging, Inc.

EFII
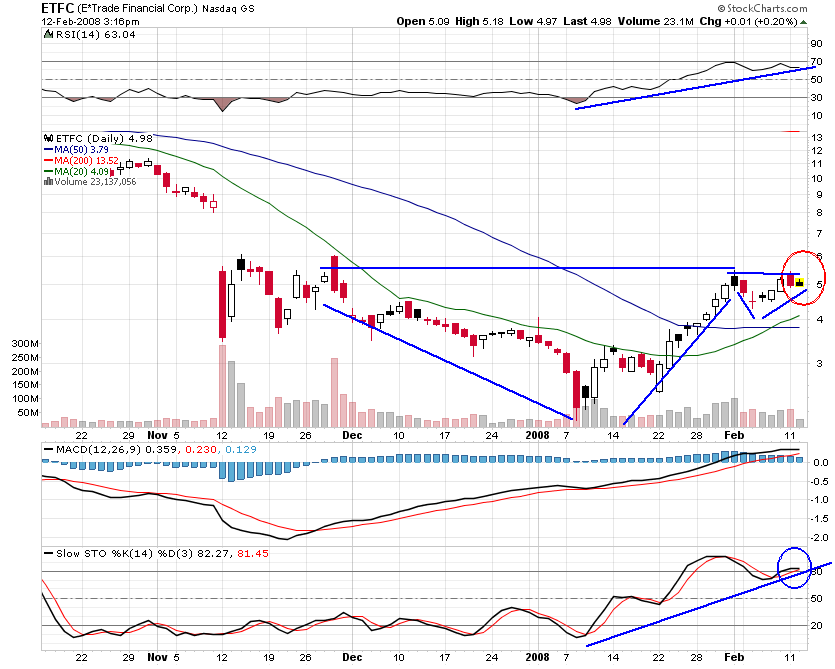
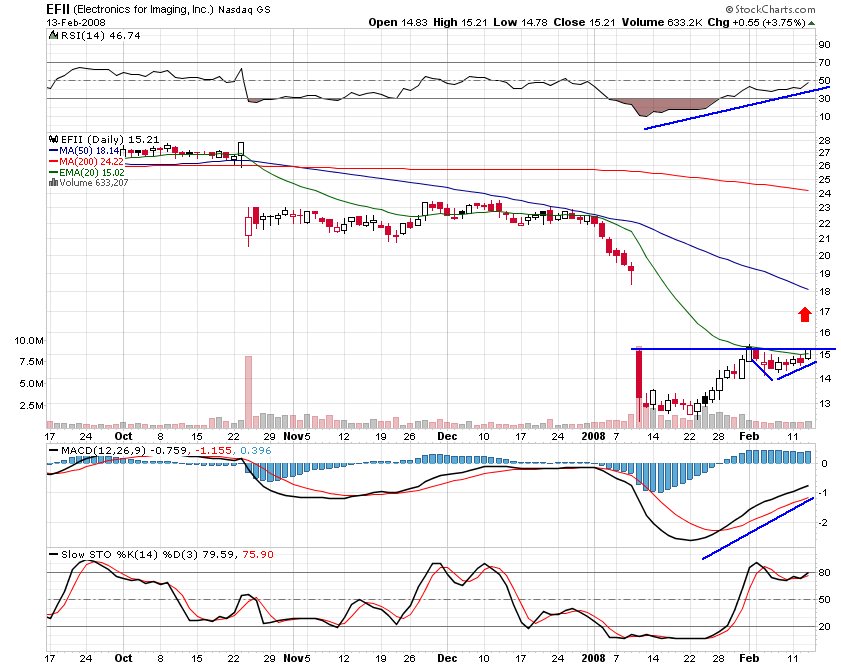
Quick and Dirty: EFI is showing the same cup and handle as e*trade setup. The price action looks nice, RSI is bastardly beautiful and MACD is trending upwards but i have to say, the Slow STO is ugly as hell. I would suggest watching what happens on this one as the signal on the STO says EFI is over bought.

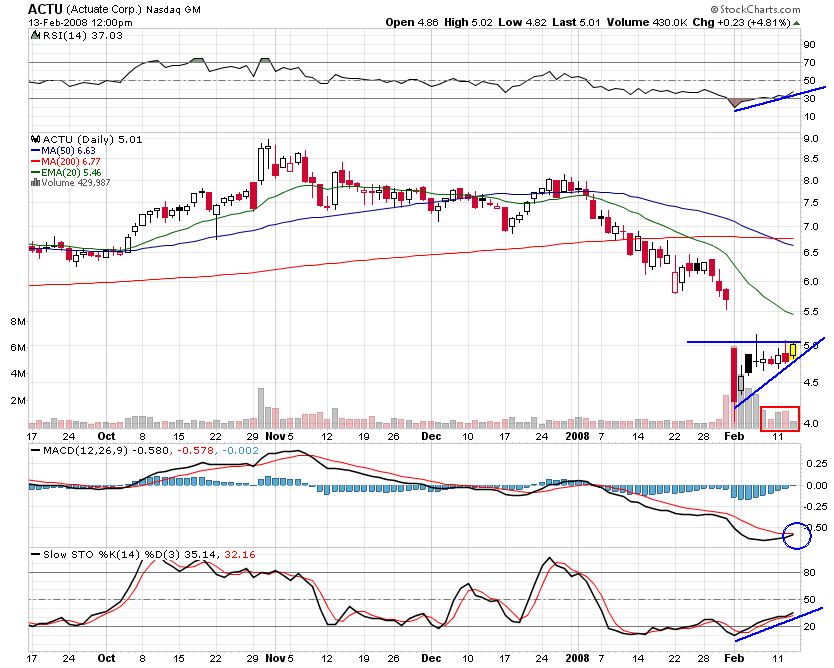
The cross through the 20 day EMA is nice, but will it be enough?

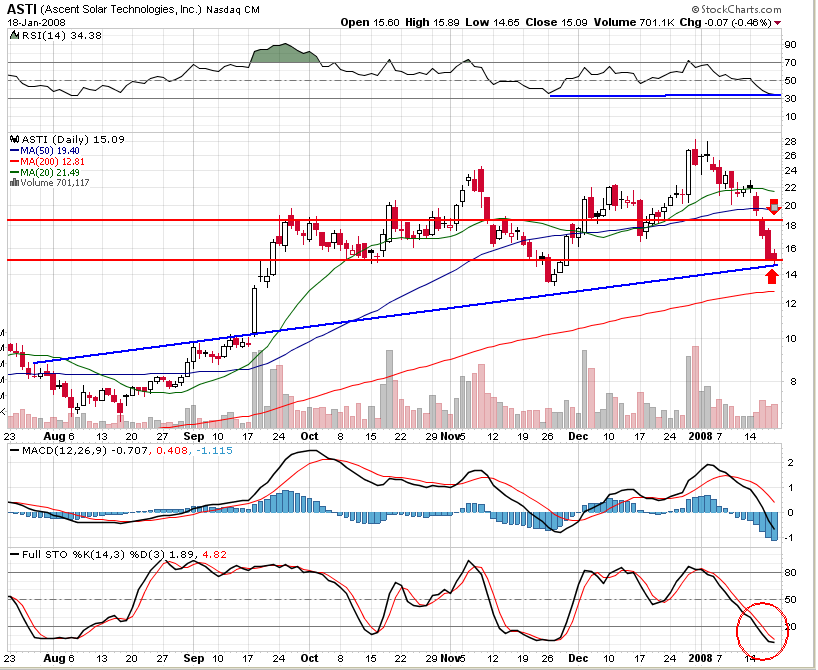
PATIENTLY wait and see if EFII can move upwards across $15.28. If it can, then ride it up as high as possible with a trailing stop loss of a few percentage points.

ACTU: Actuate Corp

actu chartI think this chart of ACTU has big potential for a break out.  Check out the setups on the RSI, MACD and Slow STO.

RSI is trending upwards with three touches on the trend line indicating a pretty solid/strong uptrend in this indicator.

The MACD is JUST about to have a bullish cross and is under -.50.  Additionally, i like the down trend the MACD had before this cross setup formed.  It’s a gradual down trend that bottomed/slowed, and is now coming up.  Nothing crazy like UP DOWN UP DOWN.

Slow STO is on the way up and still under 50.  This trend line is a bit like the RSI uptrend where it looks strong and consistent.

The price chart looks strong and could even be inside of a bullish triangle (not noted on chart).  Resistance @ about $5.00 looks somewhat weak IMO, and this may be indicative of even more potential for a break out above the $5.00 level.

Buy upon crossing up through the $5.00 resistance line and look for New resistance just under $5.50.   A ride like that could mean 10% in your pocket!

Buy when

ETFC: E*Trade Financial Corp

etradeEtrade! The big dipper, lol. Check out the setup on Etrade’s chart. IMO, it looks like a cup w/handle. The handle is a little bit small so this could be a false signal, but the cup and handle shape is definitely there.

As some may already know, the cup with handle formation is a bullish continuation pattern that basically involves creating a cup, then a small handle right after, and finally a break out upon busting through the handle’s resistance.

I think if ETFC can bust through it’s handle’s resistance it will be a nice break out. This company’s stock has taken an unjustified beating.

Buy if the price breaks out above $5.10-$5.20. Put a stop loss on it and if it explodes upwards, look for resistance just under the $8 level.

RFMD: RF Micro Devices, Inc

So this lovely chart of RFMD shows a nice drop and start of a base.  What i find attractive is the cross above 30 on the RSI and uptrend being displayed by the Full STO.

rfmdThe stock is cheap at this price compared to it’s historical performance and if looking @ a 3 year chart you can see that the RSI has only dropped below 30 three different times.

The current stock price is trending upwards and looks nice.

Buy over $3.20-$3.30 on confirmation that it’s running and i think there is a free ride to about $3.60 then possibly over $4.00.

MNTA: Momenta Pharmaceuticals Inc

mntaOn the left is a chart of MNTA.  The chart had been showing signs of significant basing action during the month of January and is now back up testing the resistance from late December of 2007.

There appears to be a channel forming with clearly defined support at  at $7.27 and resistance around $7.90 or so.

I think this is a break out candidate if it rises above the resistance @ $7.90.

Buy over $7.90 and put a tight stop loss to ensure the gains are not lost. 

ASTI: Ascent Solar Technologies, Inc

ASTI ChartASTI is looking as though it may bounce off of it’s trend line in the next few days.  In the chart i posted with this summary you can see three points on the trend line; the last being today.

The RSI is a bit above 30 and if you look back on the chart it rarely gets down to 30.

There is also about to be a roll over on the stochastic.

MACD, to me, is a bit ugly and a bit of a concern as I personally like MACD signals a lot.  I think that it may be good to wait on this one for the price to either cross or bounce off of about $15 and see whats going on.  If it crosses under and comes back up through on strong volume, then it could be a nice ride to 18-19 dollars.

I think buy around $15, and sell around $19… or after $19 just put a semi-loose stop loss on and ride it as high as you can. 

DNDN: Dendreon Corp. (Day Trade)

DNDNCheck out this trade on DNDN. The graph is from TDAmeritrade so it’s not consistent with the other images of charts on the site, but it was a pretty predictable move during today’s session.

The ridiculously huge yellow blobs show entry and exit points at about $6.72 for the entry and $6.90 on the exit. That is about an $.18 cent profit per share and while it’s not much, i feel this was a relatively safe trade and you can’t beat that.

The setup was based on a symmetrical triangle. While it looks very close to being a bearish descending triangle, the bottom support is actually slopping upwards. Giving consideration to the over all upward trend of DNDN for the day and the first low just after market open i think it is safe to consider this triangle symmetrical.

I chose the break out of the triangle as the entry point. Further confirmation was given by the Stochastic cross just before the break out.

My sell point choosen based on the consolidation that started happening around $6.90. Better to lock in some returns IMO.

DLM: Del Monte Foods

ticker DLMYum… Canned pineapple. 🙂

I have a chart of DLM and basically I think it’s about to pop OR drop. I’m leaning towards the popping side however. This could be an extremely short term trade, but imo, very profitable.

The looks to have formed a nice bowl shaped basing pattern which is coming up on it’s first level of resistance, R1. Del Monte has been consolidating nicely since early December and if it can break through R1 there is potential for it to break through R2 and possibly make it up through R3.

Del Monte’s RSI and MACD are both trending bullishly with the RSI just now crossing the 50 mark and MACD having crossed around the 17th.

Buy once there is a cross through R1 at around $9.45. With a trailing stop loss in tack, watch for it to cross through R2 at maybe $9.60 and then finally R3 @ $10.45.

DLM has the potential to run up through all resistance levels and higher but chances are not likely.

Edit: Jan 12, 2008

It looks like a cup with handle might be setting up?  4 more days will mean the handle has moved 1/3 of the cup’s advance.

DPDW: Deep Down Inc

deep down incI feel Deep Down Inc is looking pretty appealing right now.

There are a few reasons:

Looking at a fibonacci on the chart the price has gone below the 38.2% marker but is now coming back up and hit the 50% marker today. Additionally, during the dip which took this baby past the 38.2% mark volume was average to lite.

DPDW appears to be trading in a bullish channel and bouncing up from the bottom support line of said channel.

MACD is about to have a bullish cross.

RSI is on it’s way up from a bottom.

    I would consider buying this at the current price of $1.36 and riding it up until the touch of the channel’s resistance which appears to be $2.00 or higher but that could change. A semi-tight stop loss could be used on this guy to lock in any potential gains.

    SRU.TO: Starfield Resources

    sru.toGot a chart of Starfield Resources here.  This one is a penny stock but I think it looks pretty attractive.

    The $1.30 level played a strong role as a support/resistance level during the past 7 months and just recently broke through it with medium volume.

    RSI is shooting up and just passed through 50 which is a good sign.  The slope of the advance might be a little too vertical though.

    MACD is about to have a bullish cross which is very strong.

    I would say buy on the way up above $1.30.  Keep and eye on the $1.55 level and if it makes it through watch for resistance @ $1.70.  With a tight stop loss you can ride this through.